Compounding is the concept of investing and letting your money work for you. Often used is the term, “Compounding Interest” which represents the interest gained from an investment. For the post we are going to discuss the power of investing and reinvesting the gains from the investment. Gains can be from interest, dividends or asset appreciation.
First, the idea of time has to be discussed. The longer you let your money work for you the more you will make. Pretty simple concept that if you can gain 6% on you money for 30 years then you will make more money than investing for only 10 years with the same annual return. Also, an investor that invested $10,000 from their 20s-30s will make more money when they are 65 compared to a person that invests $10,000 in their 30s-40s with the same investment returns.
The chart below shows an investor putting $1,000 in a year from age 20 to 29 and another investor putting in $1,000 a year from age 30-39. Putting money away early clearly paid off with returns of $113,830 vs. $63,562.

This is a very simplified concept assuming a perfect world of 6% gains every year. Unfortunately, we know that this is not the case in the real world. We know that the stock market has daily, weekly and monthly fluctuations. These counter trends can wreak havoc on a simple portfolio. But let’s dive into some of the actual movement.
Real Market Movement
In a quick study of the market, we used the SPYa which is a proxy for the S&P 500. From 1993 to December 2015, we saw the SPY go from closing price of $46.59 to $203.87 for a gain of $157.28 in 22 years. Overall gain of 338% or roughly 15% a year. Pretty good if you ask me considering the crash of tech bubble and housing bubble are included. Let’s dive a little further into the numbers. The number above was the closing prices, so let’s look how much the SPY moved in each year from it’s low to it’s high or range on average: $28.52 or 24.8%. That means from the high to low for the year that the SPY moved $28.52 or 25.6% of the open price of that year. If you added up the range of each month from 1993 to 2015 you would accumulate to $657. That is a pretty large amount of movement…but is it a lot? Let’s look at the average monthly ranges of $8.04 and average percentage range of 7%. Let that sink in a little….each month the SPY has a high to low range of about 7%. If you added up ranges on a monthly basis you would get to:$2,220.45. Clearly $1,500 more points of movement. Seems pretty insane right. Let’s dive a little deeper. The weekly ranges: $3.81 or 3.3% with a cumulative movement of $4,563. So in any give week we will move 3.3%, month: 7%, year: 24.8% or close to close only 15%. So by now you are probably asking, “Why am I only getting 6%?” If the average has been 15% why aren’t I getting 15%. Well, there are several factors that can be blamed for this, but the most obvious is that most investors are only investing a portion of their portfolio in stocks and the balance in some fixed income or bond portfolio that has a lower rate of annual return. Average them out and take out your fees and Wall Street is happy…but are you?
We are not suggesting to go put all of your hard earned money in the stock market but merely to take a closer look at what your return is on your stock portion of your portfolio. If you are letting someone else manage your money…your are paying a fee. It may be hidden…but there is always a fee. We encourage you to see what you are actually paying…you may be very surprised at the end of the day how much your adviser is actually getting. Unfortunately, this is how Wall Street survives, continuing to collect their fees.
So you are probably asking why should I care about this information?…great question and we are glad you have stuck around thus far to see the real benefit of this information. Knowing from our initial chart that you can get exponential growth over time … what if you didn’t settle for a puny 6%.
The SPY moves 3% in a week, 7% in a month, 24% in a year….on a High to Low average average range. Is it possible to do better than 6%?
Let’s dive into these numbers just a little to get some perspective. If we look at some simple numbers we can see that the average Open to High Range is 14.8% and the Average Open to Low Range is 10.8% on the annual data. So what does this tell us?. Well quite simply, that the stock market tends to go up about 14% a year to it’s high and down 11% to it’s low. Again, these are averages. Some years they are bigger and smaller for both bulls and bears.
Obviously, the stock market does not go directly to a low then to a high or vice versa. It ebbs and flows with cycles in the economy. There are predictable patterns, support and resistance areas and momentum that can be found on the historical chart of prices. If we can ride the bullish phases and avoid the bearish phases then we are immediately reducing our time in the market and reducing our risk. This alone will improve our results.
In addition to investing on the bullish phases we can use leverage. We use stock call options to buy in the bullish phases. The stock option allows us to buy for a only a fraction of stock’s price. We can buy options from any price range depending on our investment capital and target. We want to mimic the results of the stock so we buy the more expensive options(disclaimer: simplified for this article…anyone interested in investing with options should make sure they understand them before investing!)
The Return
For example , if we have a $100 stock we could buy a $20 call. Let’s say the stock/ETF goes up $6 or 6% . The option will only go up a portion of that amount…say 75%, so then we would make $4.5(75% *$6). The lesser amount isn’t as high as the six but look at the percentage return.
For the stock we returned 6%. For the option we returned: 22.5%($4.5/$20). We only invested 1/5th of the amount of money and got 22.5% return on it. We could have bought any quantity of options to increase our return.
So if we bought 100 shares of the $100 stock, that would cost us: $10,000. The option, to have 100 shares would be 1 contract at $20 or $2,000.
If we invested $6,000 in the option, then we would have received our 22.5% or $1,350 in profit. This is $750 more than our stock for only 3/5th the risk.
Assuming we did nothing with the rest of our $10k we would have a gain of $1,350. If we simply look at the return compared to $10k we are now looking at 13.5% return.
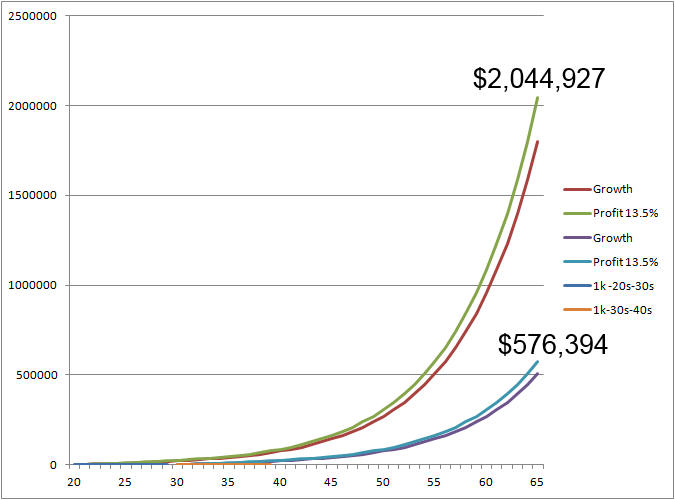
If we put a 13.5% return into our compounding chart we can see a dramatic difference.

This is where you can truly see the power of compounding. If we did 13.5% return per year for both examples above we can see that the investor who put money in his/her 20’s would accumulate over $2 Million vs the 6% return of only slightly over $113,000. The investor in their 30s would accumulate $576k with a 13.5% compound vs $63k with 6% compound.
Both examples are dramatically increased and we showed you just one simple example of how to increase your return.
Hopefully, we have shed some light onto the seedy underbelly of Wall Street’s secret and encourage you to get educated and take control of your own portffolio.
We will leave you with 3 simple concepts:
1)How much is truly possible knowing that the monthly range is 7% and the weekly range 3%? A 3% gain on the stock can turn into something special when you use an option, especially if you do that a several times a year.
2)These numbers are for the SPY and individual stocks can be more lucrative.
3)It is possible to investing in the bear phases the same way as the bullish phases.(remember the SPY averages down 10% a year to its low!)
If you want to learn more then we encourage you to check out our newest course: The Hybrid Investing Strategy